Creating plots from command line is very usefull when you deal with lots of data. Since this operation will be repetitive I encourage you to have your own elaborated script, so you can plot fast and easily.
For Matplotlib you need a source file with extension .py which has all the instructions in python language. Once you have your source file you just have to execute:
[user@andromache directory]$ python script.py
#If you followed the installation steps on the intro then python=trython
[user@andromache directory]$ trython script.py
Matplotlib will read the instructions on the style template and will show you the plot on your screen, until you kill the window, also you can export it into an image or vector file.
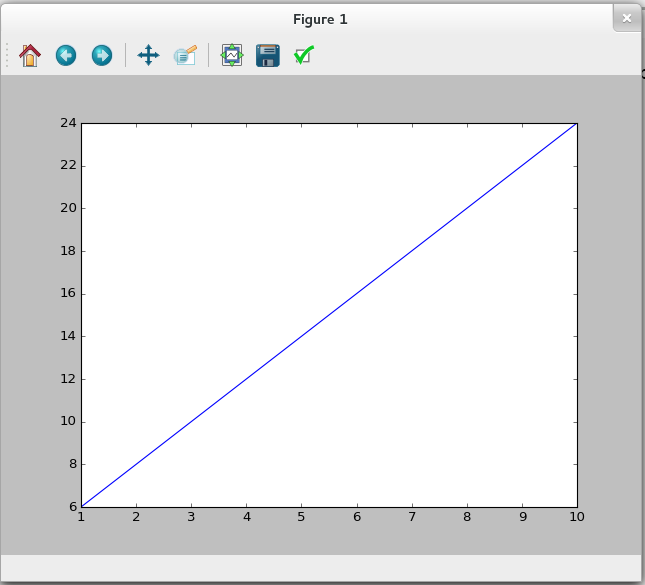
The first plot
Now we are going to make the most basic data plot with this data file.
- Create your source file with the extension .py with the following instructions in it.
import matplotlib.pyplot as pl
import numpy as np

#Load a file with numpy library
data = np.loadtxt('linear_data.dat')

# Creating the layer and ploting both data ranges
ax1 = pl.subplot()   #ax1 variable will do as pl.subplot()

# Plots  all elements from column 0 (:,0)
# versus all elements from column 1 (:,1)
ax1.plot(data[:,0],data[:,1])
plt.show() #Shows into your screen the plot
- Here you can download this example template.
- Be sure you have this data in the same directory were you have your template file.
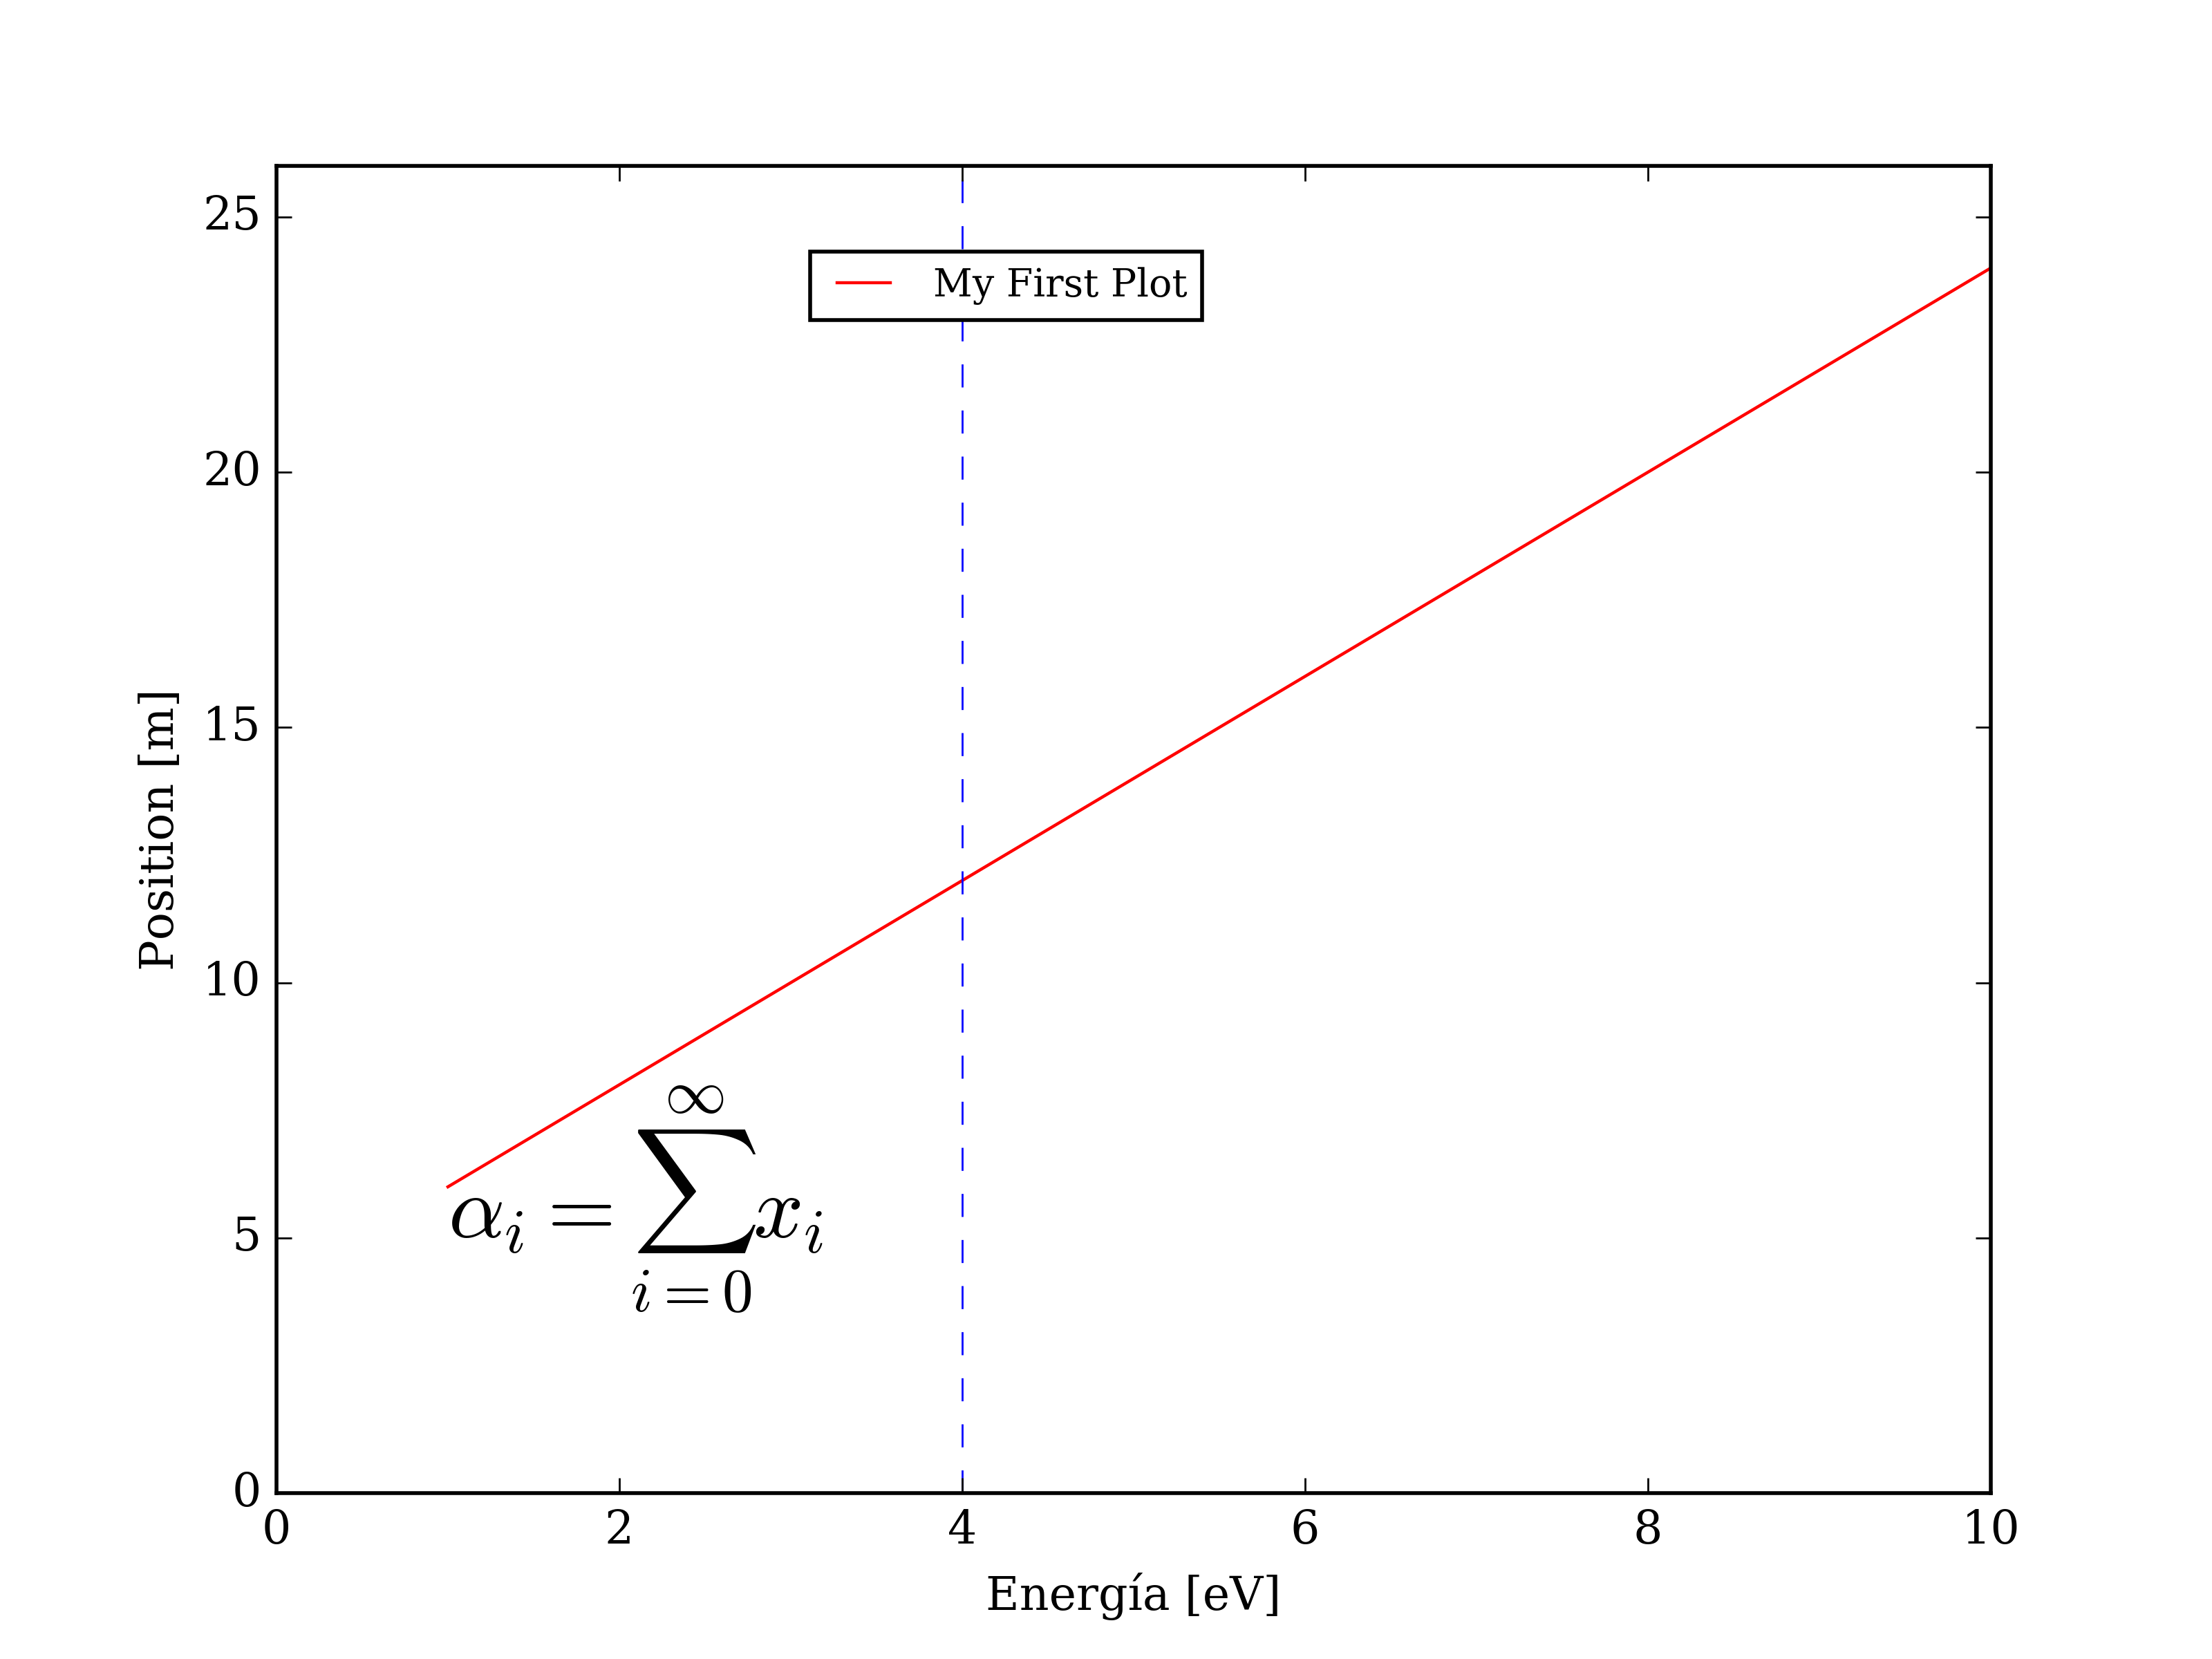
Enhanced plot
In matplotlib we can modify all the plot elements, such as labels, boxes grid, x and y tics. Once you make your own template you will find very easy modify this elements. This template has the most important flags to modify you plot.