Line & point styles
You can make a dinstintion between curves changing the lines and points style, as well as the width and colors. But remember that your plots will probably be printed in black & white, so it is highly recomended to use a grayscale for colors.
To modify a line style you have to add the next line on your template file.p.
set style line 1 lt 1 lw 1 pt 1 ps 1 lc rgb "red"
line  is the label of the style your modifying, it must be an integer.
lt  is the line type your line style, it must be a positive integer.
lw line width of your style, could be fractional.
pt point type of your style, must be integer.
ps point size of your style, could be fractional.
lc  style color you can use rbg nomenklature, either name or hexagecimal notation.
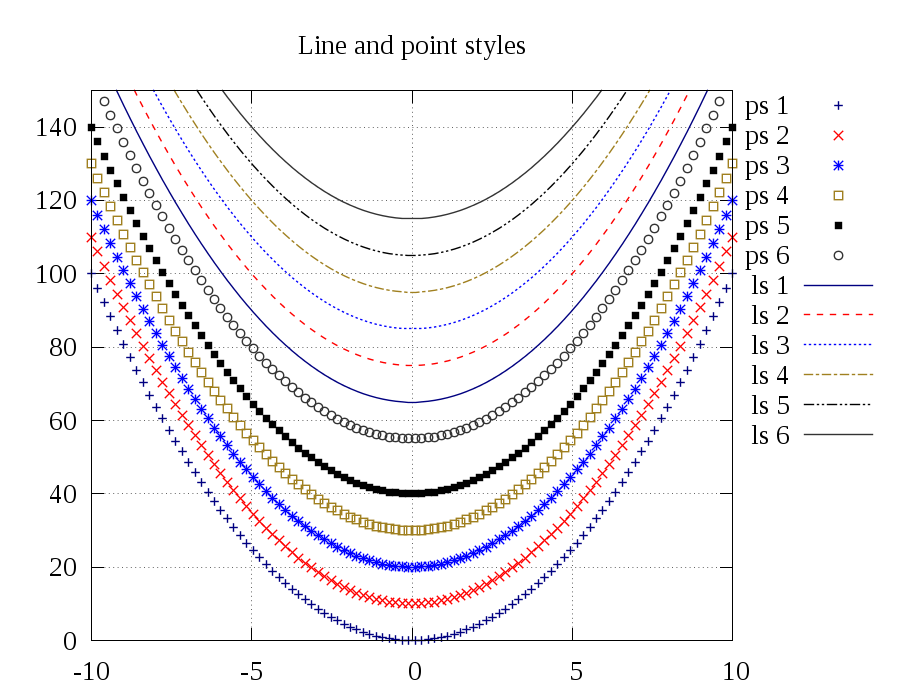
Example of line and point styles
The following lines will create different lines and styles on a plot.
set style line 1  lt 1  lw 0.9 pt 1 ps  0.9 lc  rgb "navy"
set style line 2  lt 2  lw 0.9 pt 2 ps  1.1 lc  rgb "red"
set style line 3  lt 3  lw 0.9 pt 3 ps  1.1 lc  rgb "blue"
set style line 4  lt 4  lw 0.9 pt 4 ps  1.1 lc  rgb "olive"
set style line 5  lt 5  lw 0.9 pt 5 ps  1.1 lc  rgb "black"
set style line 6  lt 6  lw 0.9 pt 6 ps  1.1 lc  rgb "gray20"
To generate this plot download this file: lines_style.p.
To choose between lines, points or a combination, you have to specify it on the plot line.
  plot x**2+0  title 'line 1' with lines ls 1, \
       x**2+10 title 'point 2' with  points ls 2, \
       x**2+20 title 'linespoints 3'  with linespoints ls 3;
This will generate 3 diffent styles, the first one a solid line because the ls 1, the second red cross points because ls 2, and the third a combination of a dash line and an asterix point.