Spectrum plots
It is common to plot spectrums such as: infra red, ramman, uv-vis or xray-data. When you have several spectrums it is very difficult to distinguish between them. In this cases the filled curve is usefull. Transparent filled curves are visually atractive to make presentations. Here we put several ideas to make spectrum plots.
To generate the following plots you need to download:
first_ir.dat, second_ir.dat
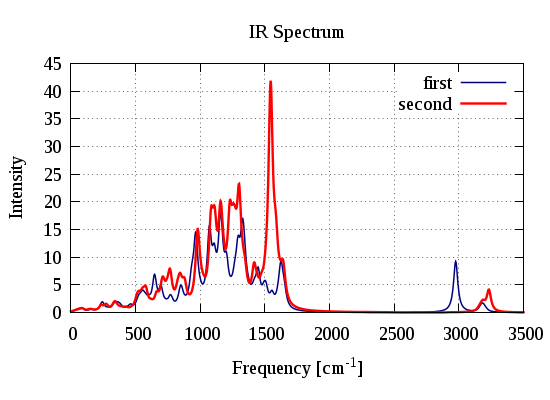
Diferent linewith
set style line 5  lt 1  lw 2.2 pt 1 ps  1 lc  rgb "navy"
set style line 11 lt 1  lw 1.5 pt 1 ps  1 lc  rgb "red"

plot "first_ir.dat"  using 1:2 title 'first'  with lines ls 5, \
     "second_ir.dat" using 1:2 title 'second' with lines ls 11;
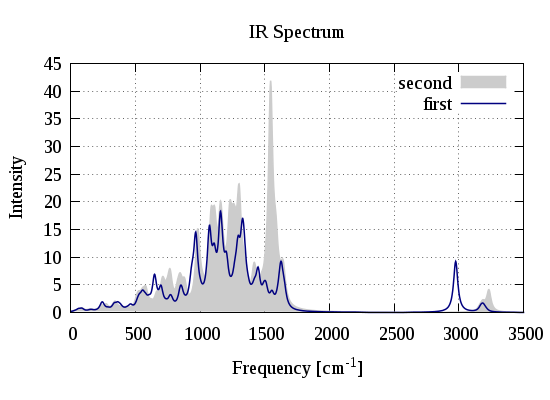
Filledcurves and lines
set style line 5  lt 1  lw 2.2 pt 1 ps  1 lc  rgb "navy"
set style line 11 lt 1  lw 1.5 pt 1 ps  1 lc  rgb "gray80"

plot "second_ir.dat" using 1:2 title 'second' with filledcurve ls 11, \
     "first_ir.dat"  using 1:2 title 'first'  with lines ls 5;
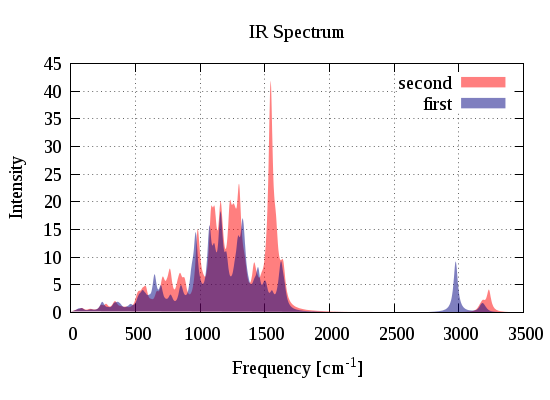
Filled transparent curves
Unfortunately transparent filledcurves is not supported in postscript eps terminal. To have a great plot is recomended use the pngcairo terminal, and to render the plot twice the size and then to rescale it.
set style fill transparent solid 0.5 noborder

set style line 5  lt 1  lw 2.2 pt 1 ps  1 lc  rgb "navy"
set style line 11 lt 1  lw 1.5 pt 1 ps  1 lc  rgb "red"

plot "second_ir.dat" using 1:2 title 'second' with filledcurve ls 11, \
     "first_ir.dat"  using 1:2 title 'first'  with filledcurve ls 5;