Creating plots from command line is very usefull when you deal with lots of data. Since this operation will be repetitive I encourage you to have your own elaborated script, so you can plot fast and easily.
To properly load your script template, the file most have the .p extension.
example  estilo.p
[user]$  gnuplot estilo.p -p
Gnuplot will read the instructions on the style template and will show you the plot on your screen, until you kill the window.
The first plot
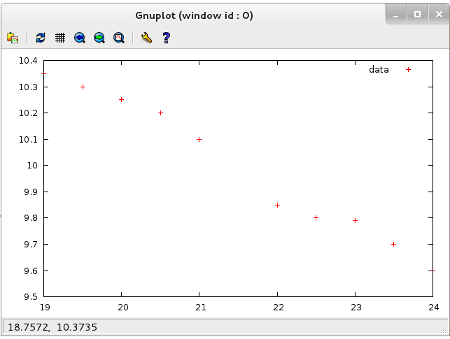
Now we are going to make the most basic data plot with this data file.
- Create your template file with the extension .p with the following instructions in it.
plot "linear_data.dat" using 1:2 with linestyle ls 0 ;
- Here you can download this example template.
- Be sure you have this data in the same directory were you have your template file.
- If you have both files in the same directory you just have to type command below to display the plot.
[user]$ gnuplot estilo1.p -p
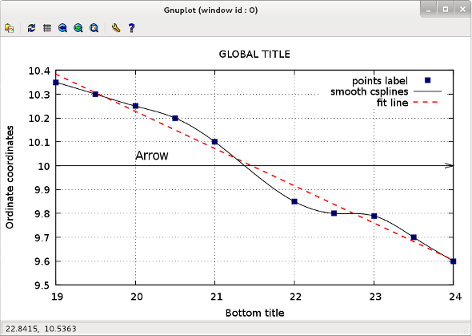
Enhanced plot
In gnuplot we can modify all the plot elements, such as labels, boxes grid, x and y tics. Once you make your own template you will find very easy modify this elements. This template has the most important flags to modify you plot.